ve
Twitter Map
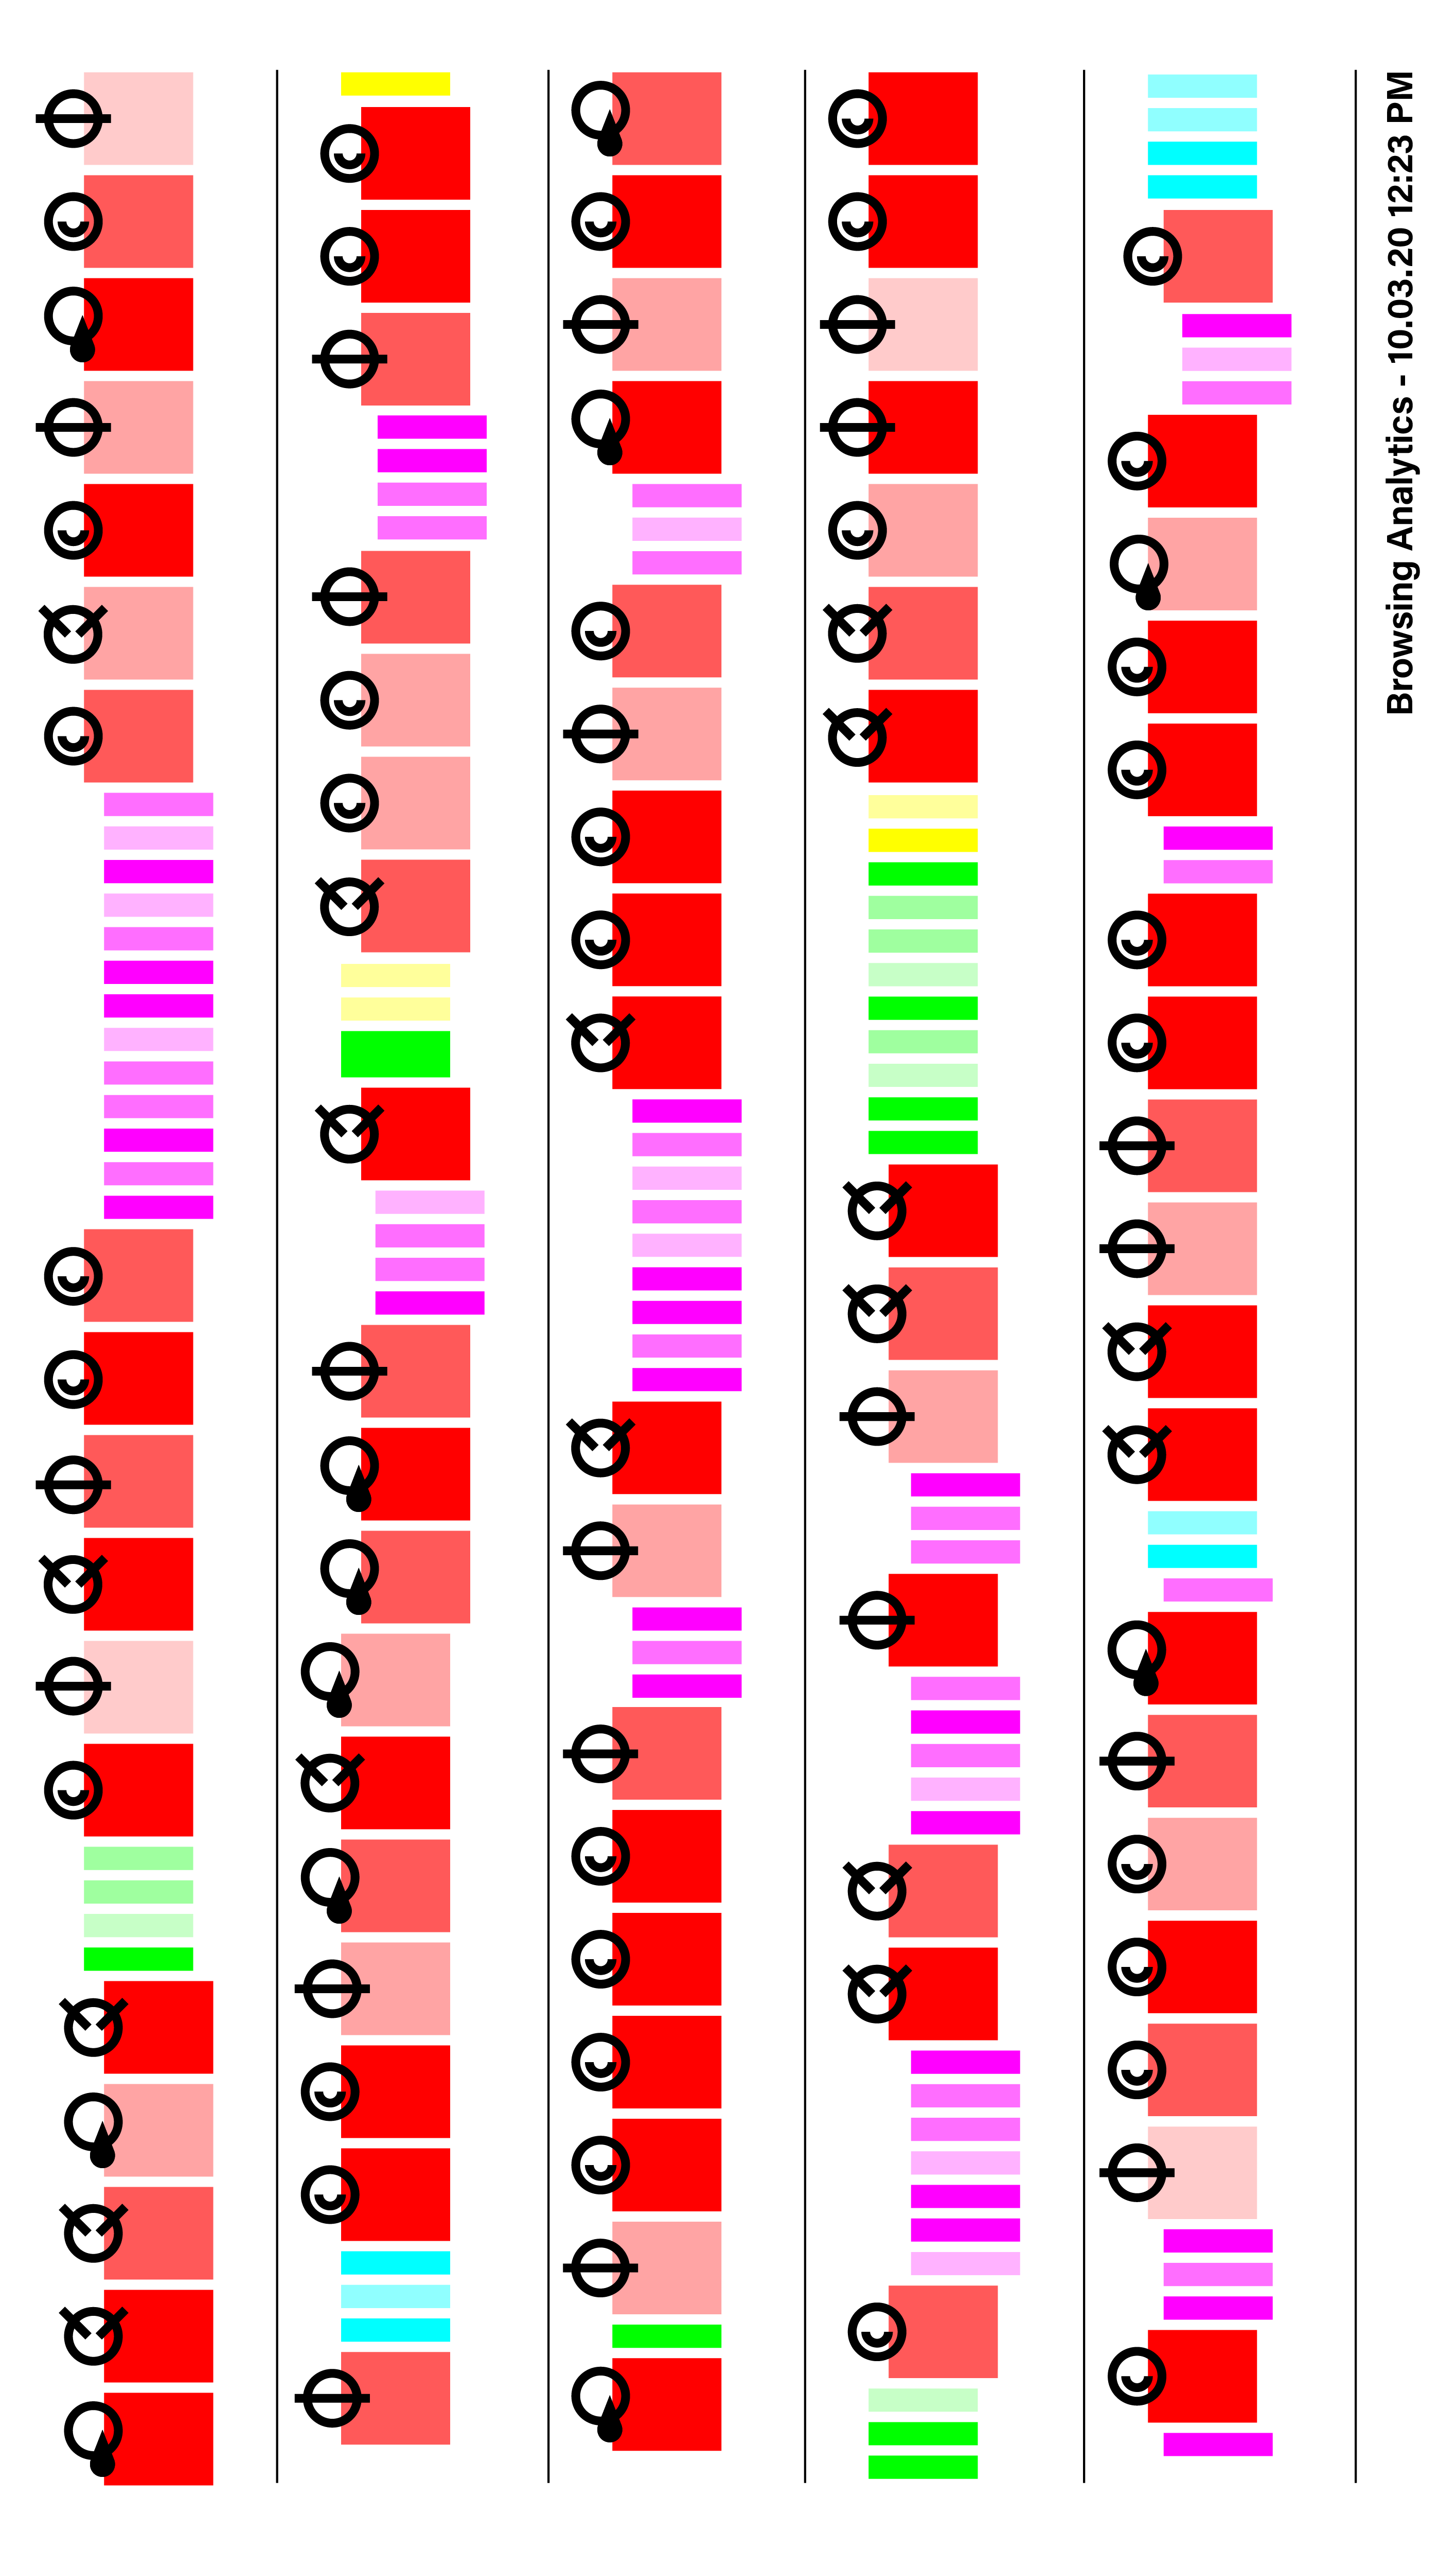
To further understand how the Twitter mobile app is laid out, I replicated how its modular parts are organized with a colored system of rectangles. I then created a system of icons and an “Interest and Engagement Scale” that I used to document my chronological emotional responses to each respective tweet, headline, and reply to get a better understanding of my time spent on the app.